Chainlink Price Prediction
Methods To Predict The Price Of Chainlink (LINK)
Getting Started -
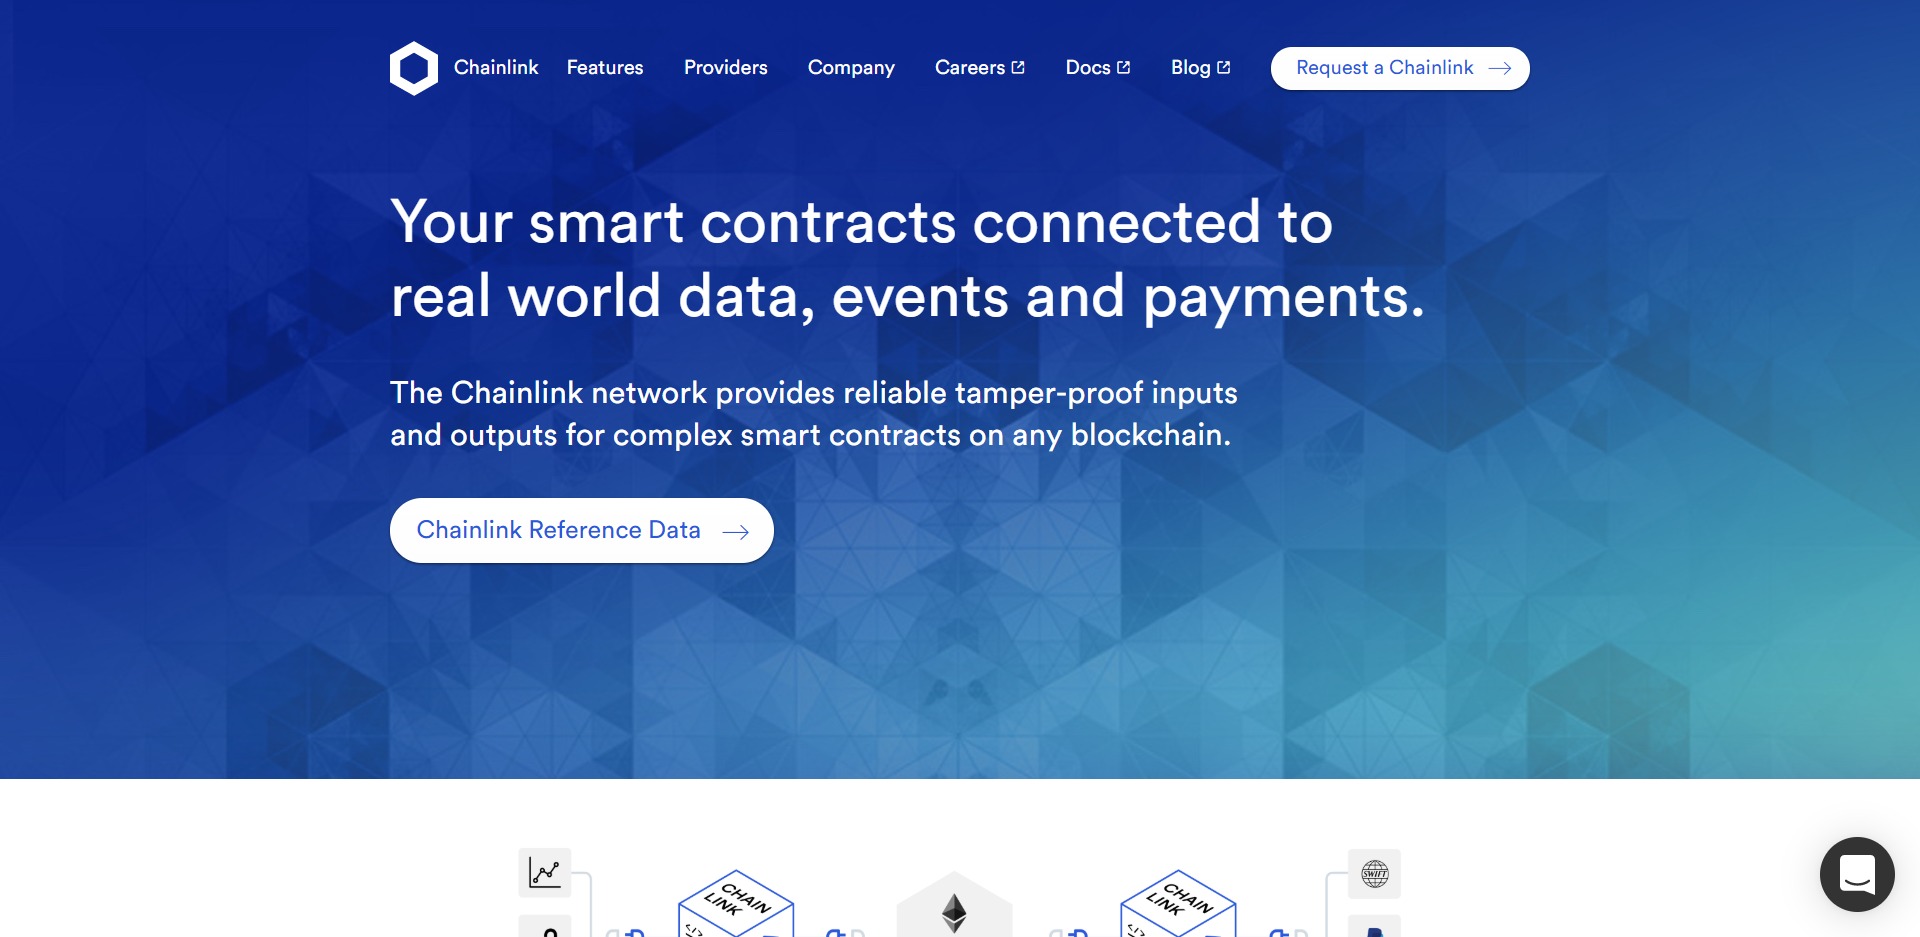
What Is Chainlink?
Chainlink is a decentralized oracle platform feeding smart contracts data in an accurate and timely manner. Chainlink experienced high volatility in 2019 with a low of $0.20 and a high of $3.00. Today we’ll be looking at how you can use methods such as technical and fundamental analysis to formulate your own Chainlink price prediction
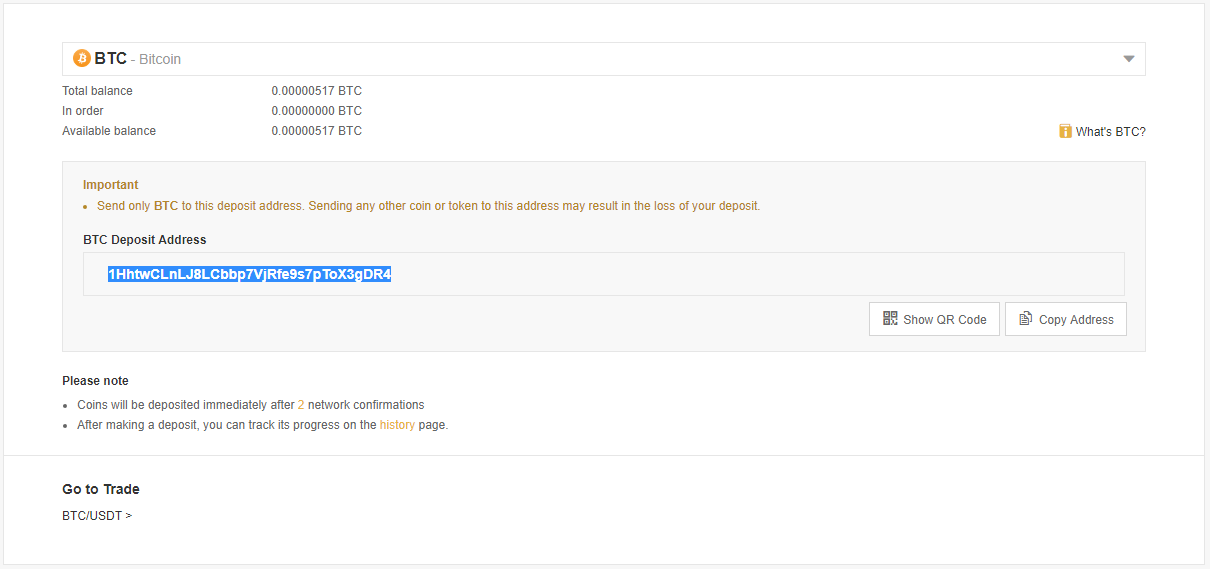
Chainlink (LINK) is available for purchase on the following exchanges
If you’re unfamiliar with how to buy Chainlink (LINK), follow the link below.
Price Action -
Analyzing The Price Of Chainlink (LINK)
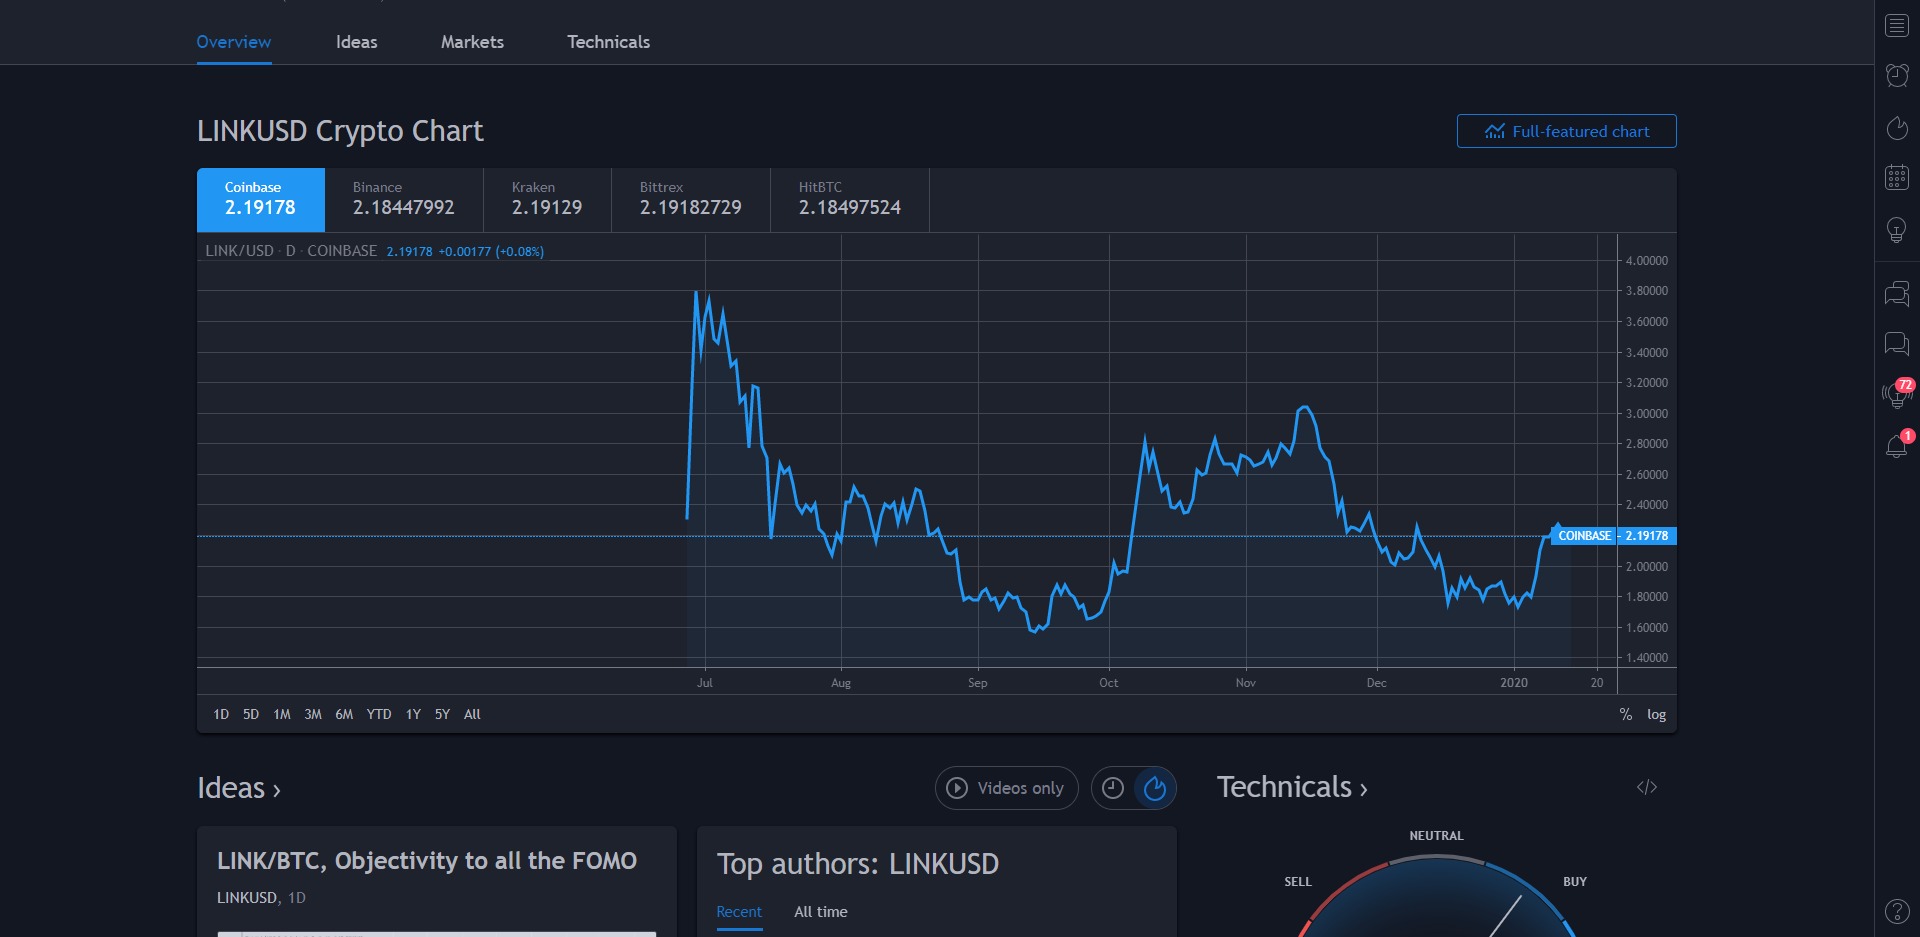
One of the simplest methods to predict the future price of a cryptocurrency like Chainlink (LINK) is by looking at prior price history on a chart. Through the use of common technical analysis techniques such as identifying horizontal support and resistance levels, calculating moving averages and calling on indicators to signal strength or weakness in the market.
The large majority of popular cryptocurrencies are available to chart and analyze on TradingView. TradingView integrates with popular exchanges like Binance, Huobi, ByBit, Kucoin and many more to offer real-time price data on a wide range of Altcoins such as Chainlink (LINK).
Price Action -
Analyzing The Price Of Chainlink (LINK)
One of the simplest methods to predict the future price of a cryptocurrency like Chainlink (LINK) is by looking at prior price history on a chart. Through the use of common technical analysis techniques such as identifying horizontal support and resistance levels, calculating moving averages and calling on indicators to signal strength or weakness in the market.
The large majority of popular cryptocurrencies are available to chart and analyze on TradingView. TradingView integrates with popular exchanges like Binance, Huobi, ByBit, Kucoin and many more to offer real-time price data on a wide range of Altcoins such as Chainlink (LINK).
Technical Analysis -
Identifying Support & Resistance Levels
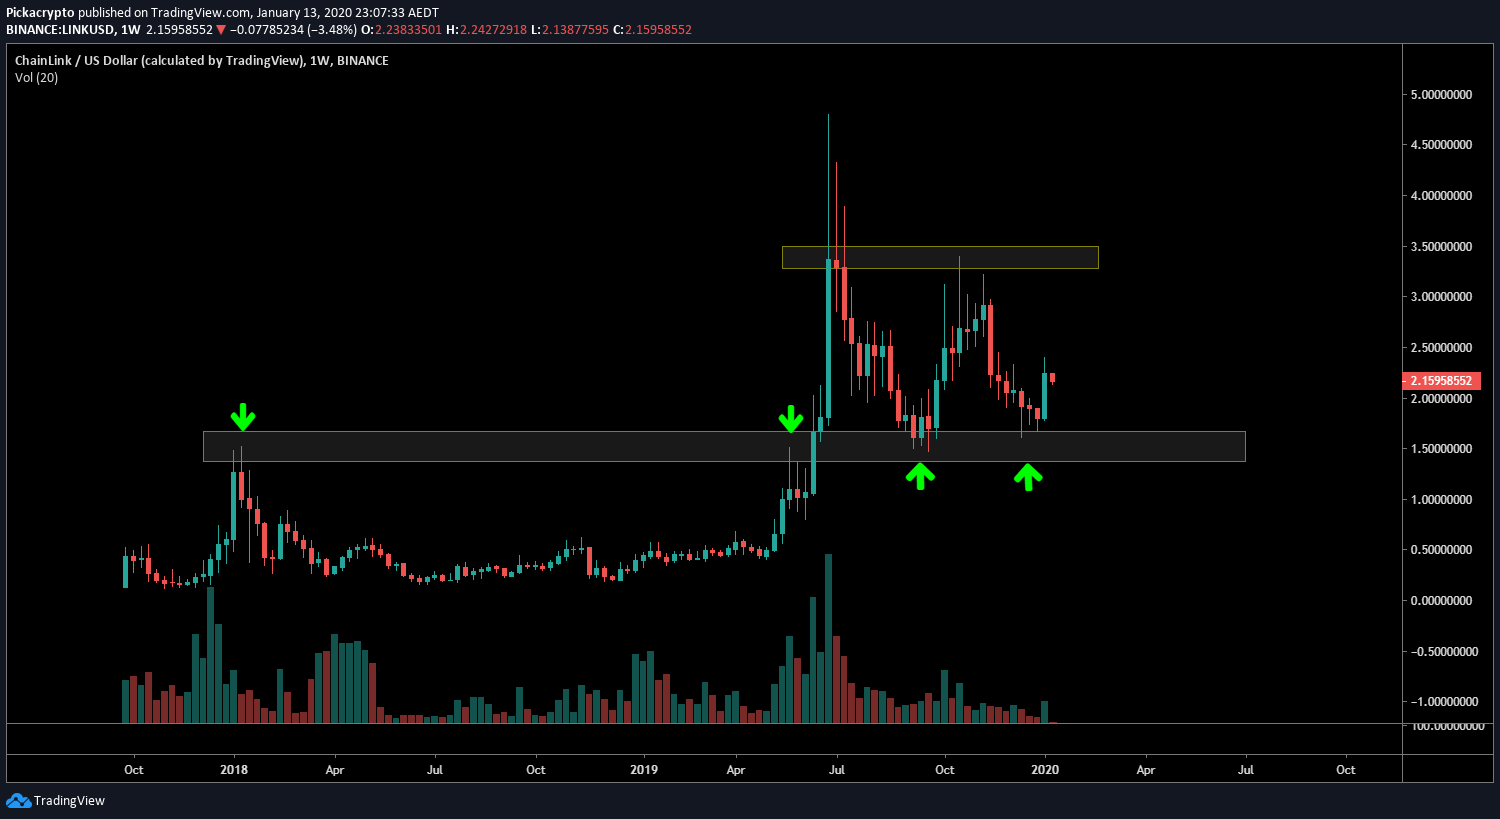
Identifying levels of support and resistance are often all it takes to gather a basic idea of where price of cryptocurrencies like Chainlink may be headed. Horizontal resistance levels can be identified by counting the amount of times a price is tested and rejected on an attempt upwards. Horizontal support levels can be identified by counting the amount of times a a price tests and bounces from a particular price on the way down.
In the following chart we can see that LINK has had many interactions with the $1.50 USD area and what was once resistance has been tested as support twice from a weekly outlook. Price is currently struggling to stay above $3.50. From this data you may be able to create your own LINK price prediction and trade accordingly.
Technical Analysis -
Using Moving Averages
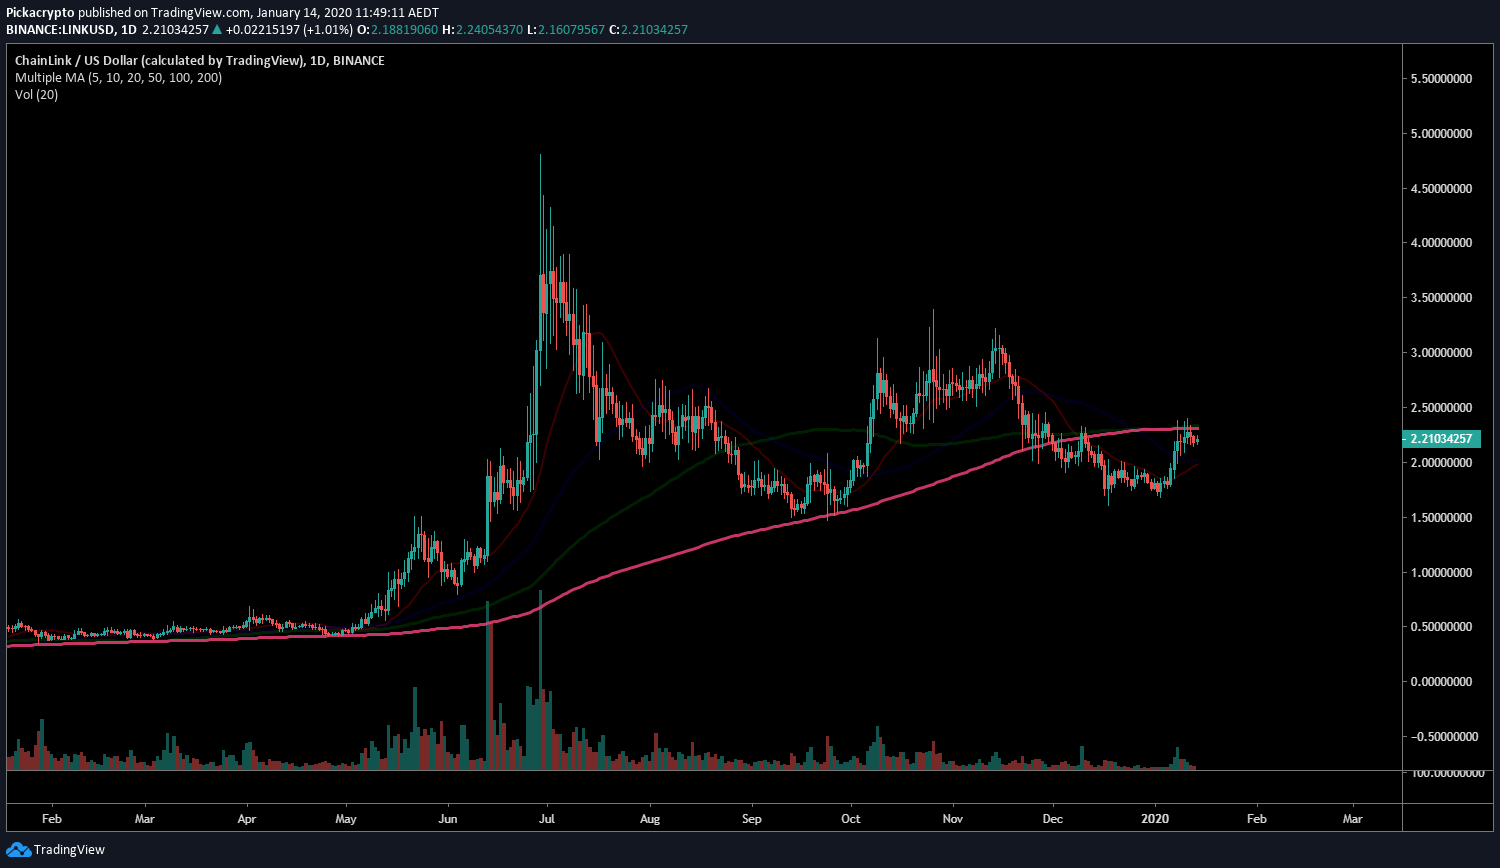
Moving averages are used by many Traders to assess momentum and potential levels where price is likely to bounce from a downtrend or start slowing down after an uptrend. With the use of several important moving averages such as the 20, 50, 100 and 200, Traders can get a good idea of where to buy Chainlink (LINK) and where to sell for profit.
In the following image we can see that LINK has bounced and rejected from the 1D 200MA which is represented by the bright pink line running through the chart. From this we can assume that this line will remain important in a Traders decision to buy or sell Chainlink (LINK)
For long term investing or trading, look at moving averages on the daily or weekly charts for important levels in which to form your Chainlink (LINK) price prediction.
Technical Analysis -
Using Moving Averages
Moving averages are used by many Traders to assess momentum and potential levels where price is likely to bounce from a downtrend or start slowing down after an uptrend. With the use of several important moving averages such as the 20, 50, 100 and 200, Traders can get a good idea of where to buy Chainlink (LINK) and where to sell for profit.
In the following image we can see that LINK has bounced and rejected from the 1D 200MA which is represented by the bright pink line running through the chart. From this we can assume that this line will remain important in a Traders decision to buy or sell Chainlink (LINK)
For long term investing or trading, look at moving averages on the daily or weekly charts for important levels in which to form your Chainlink (LINK) price prediction.
Technical Analysis -
Utilizing Indicators
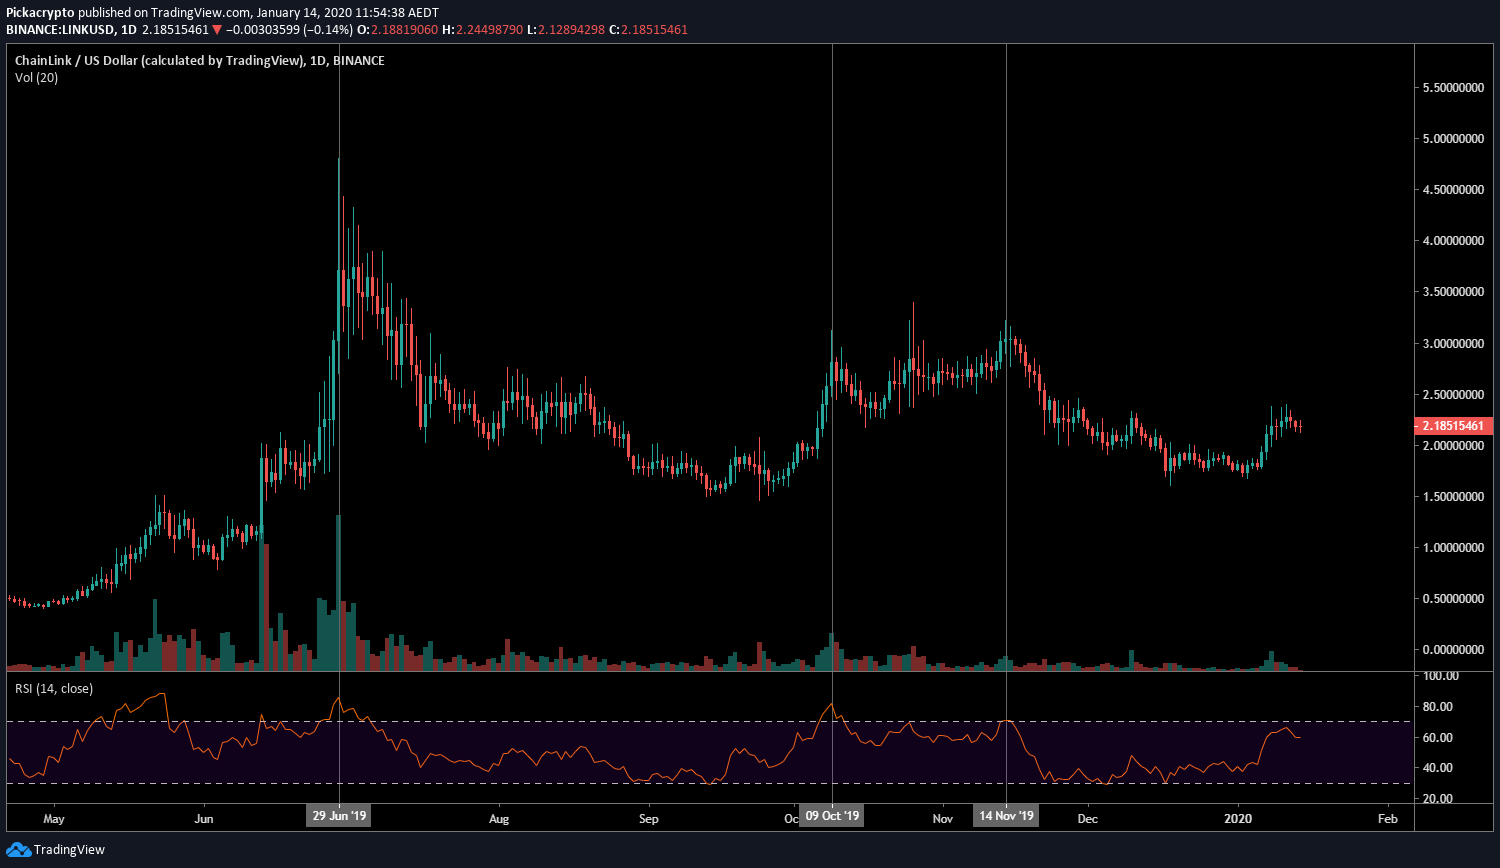
Indicators can assist Traders in making a prediction on whether the price of Chainlink (LINK) will go up or down. Indicators take into account various factors such as time, volume, momentum and many more to indicate whether a cryptocurrency like Chainlink (LINK) should to rise or fall.
In the following image we can see that the RSI (Relative Strength Index) Indicator which is used by a large majority of Traders is located at the bottom of the chart. The areas above and below the dotted lines indicate whether Chainlink (LINK) is overbought or oversold.
We’ve highlighted three different occasions where LINK has been overbought which quickly resulted in the beginning of a downtrend.
Fundamental Analysis -
Assessing Strengths & Weaknesses
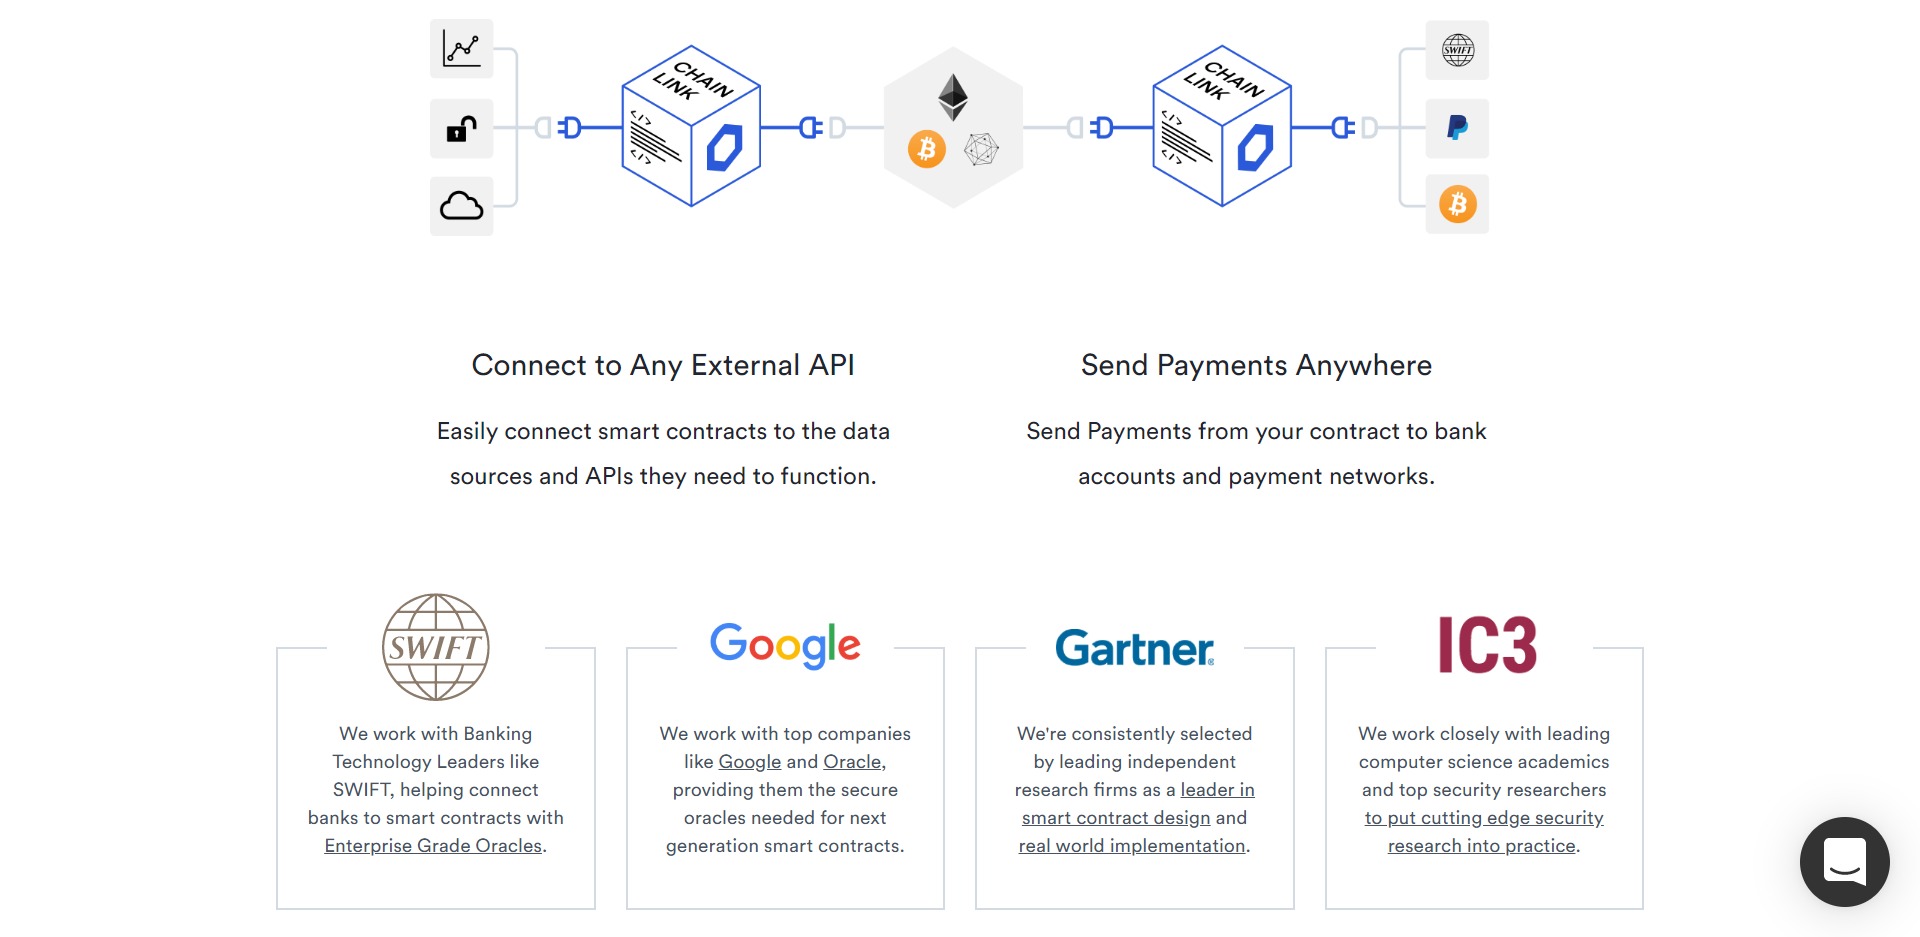
Another way to make a Chainlink (LINK) price prediction is by assessing what the project has accomplished or plans to accomplish in the near future. Keeping up to date with Chainlink (LINK) news and planning the buy or sell Chainlink (LINK) around key events is a method long term Traders use consistently.
While technical analysis may assist Traders in deciding when to buy or sell Chainlink (LINK), fundamental analysis can often help forecast future price based on the knowledge of upcoming notable events or breaking news which may have an immediate and unexpected affect on price, regardless of what the charts show.
Keeping up to date with important Chainlink (LINK) news will give Traders an edge where technical analysis falls short.
Fundamental Analysis -
Assessing Strengths & Weaknesses
Another way to make a Chainlink (LINK) price prediction is by assessing what the project has accomplished or plans to accomplish in the near future. Keeping up to date with Chainlink (LINK) news and planning the buy or sell Chainlink (LINK) around key events is a method long term Traders use consistently.
While technical analysis may assist Traders in deciding when to buy or sell Chainlink (LINK), fundamental analysis can often help forecast future price based on the knowledge of upcoming notable events or breaking news which may have an immediate and unexpected affect on price, regardless of what the charts show.
Keeping up to date with important Chainlink (LINK) news will give Traders an edge where technical analysis falls short.
Those Are The Tools
Join TradingView and make own Chainlink (LINK) price prediction today
More Resources
Chainlink Price & Market Statistics || How To Buy Chainlink || How To Leverage Trade Chainlink